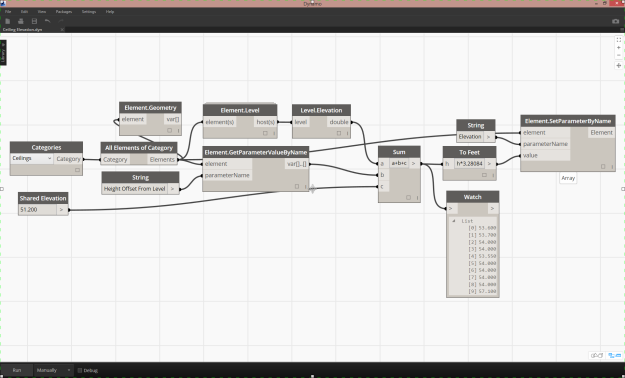
A simple way to try out Dynamo on building projects is to use it to extract, compute and move building data. One example that I love to show uses the problem of tagging and scheduling building component elevations in Revit. Last week my buddy Hannes (svensken) at Dark asked about this for Ceilings. I decided to make a short (and fast) video recording of one way to do it:
This example uses an already existing parameter (Height Offset From Level), and adds it’s value to a (manually entered) number. If the objects your are manipulating do not have this parameter, you can extract their geometries, find vertices and their respective Z-coordinates. I believe you also can extract the global elevation automatically from Revit’s Site Location, but that may require Python/API work. The definition produced in the video only works for Ceilings hosted on Level 1. To make it work on multiple Levels, install Andreas Dieckmann’s Clockwork Package, use Element.Level and add the Level Elevations to each Ceiling.
It is a common misconception that Dynamo is a geometry engine for Revit. William Wong at CASE recently wrote about that in his blog post Dynamo: More Than Grasshopper Lite. Dynamo can build advanced, mathematically defined geometry. So can Grasshopper. But Dynamo can also compute building data. And that makes it a unique product.
Using examples like these can be a good way to learn visual programming, test Dynamo on projects and teach your colleagues about data manipulation. Let me know if you come up with other ideas!


