While I announced the sharing feature – and its corresponding API – some time ago, I still had some work to do before it could go live on the Dasher site: largely around supporting timezones properly when specifying time ranges for data display, but there were some other minor tweaks needed, too. Anyway, the feature is ready enough for people to kick the tyres on it, at least.
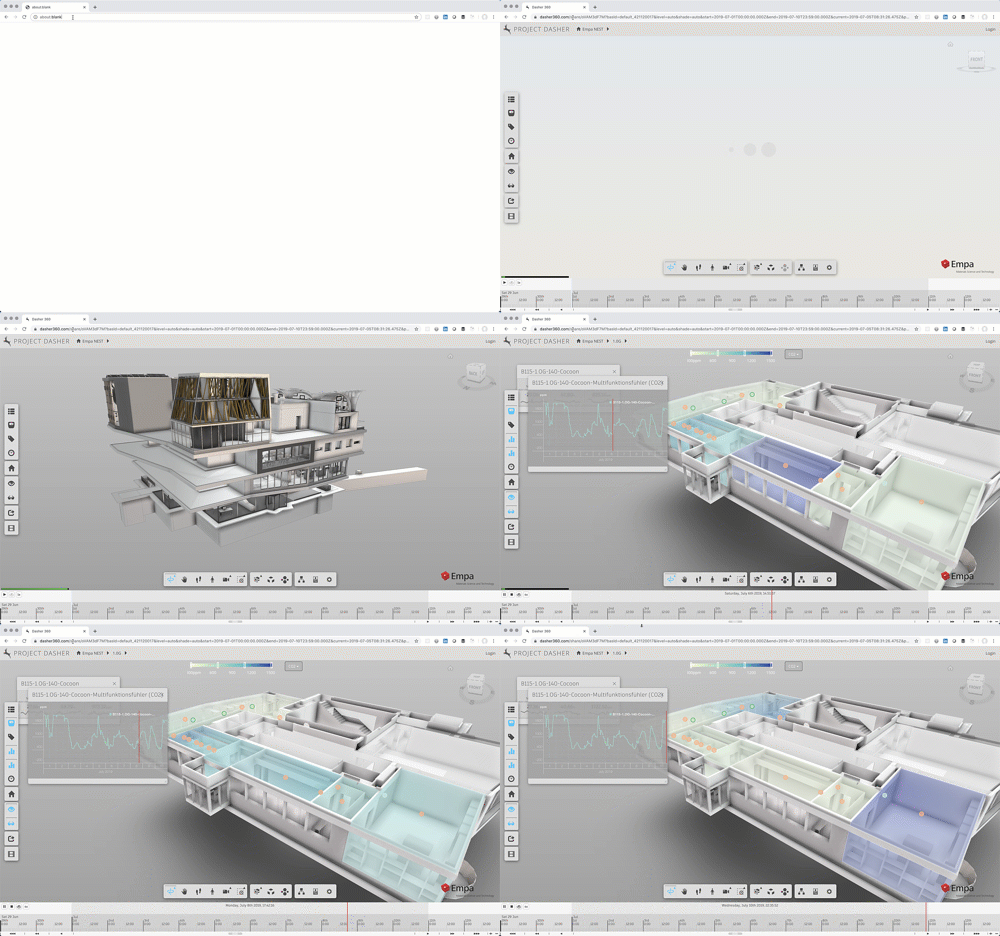
Here’s a link which will launch the public Dasher demo for you, taking you straight into a “surface shading” view for C02 values on the 1st floor, bringing up the graph for a particular location:
Here’s an animation of this page loading on my system:
(This is very low-resolution, given the size of the…


