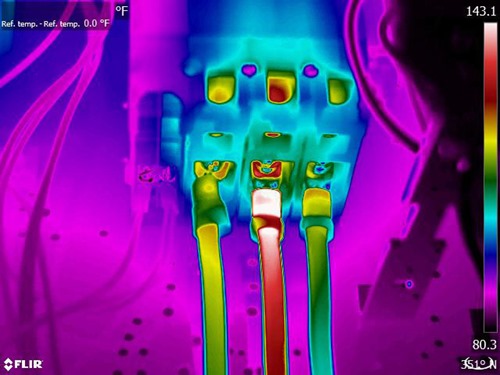
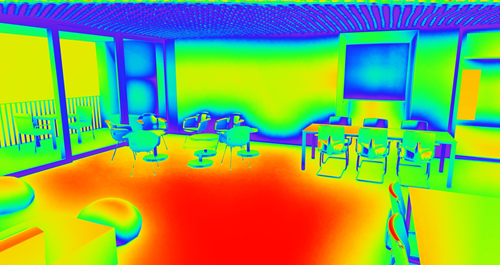
In the last post we looked at how it’s possible to take temperature data from a thermal image and use the Data Visualization Extension to connect that information to locations in a 3D Forge viewer scene.
In this post we look at how we can use the events from the same extension to display a simple tooltip showing the temperature when one of these locations is hovered over.
Let’s start by looking at what we get from the thermal image. It’s pretty simple: we have colour. As we’re averaging a number of pixels it’s likely to be on a gradient, across the chosen palette, so we’re going to have to do a little work to get the numeric temperature value it represents.
Last time we talked about using this site to generate synthetic thermal image. The site doesn’t specifically talk about the palette that’s used for the image generation, but the closest I could find is Rainbow HC from the FLIR website:
This palette includes all the colours shown in the source scene:
Looking at…


