Our resident spatial-analyst-in-chief, Rhys Goldstein, has gone and done it again. After his very well-received Medium post explaining grid-based pathfinding was published in Towards Data Science, Rhys has now had a follow-up post published that explains our work on visibility. And it’s fantastic!
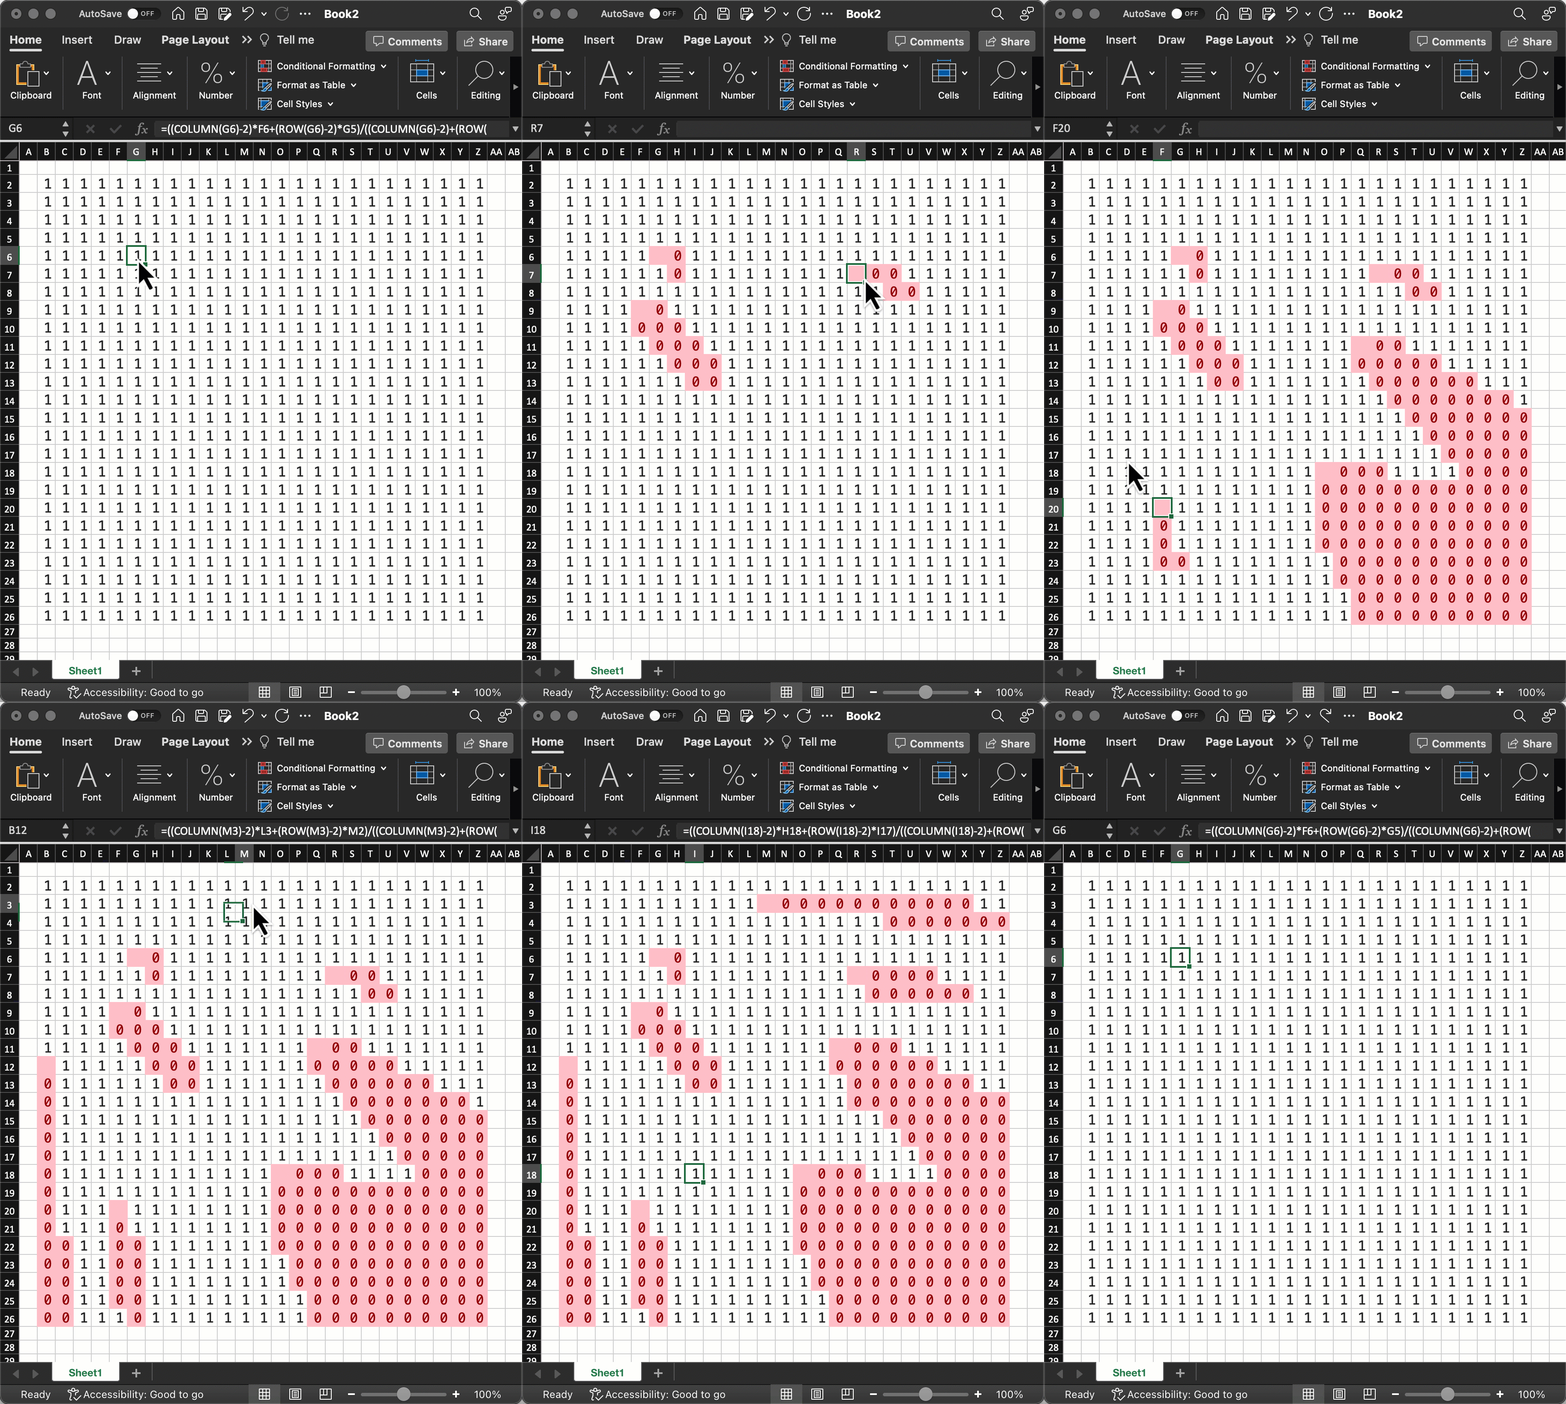
Rhys explains the novel, grid-based approach to testing visibility that was implemented in our Space Analysis Dynamo package – something that is very different from the more traditional ray casting/Isovist technique that’s common in the industry – and shows how the technique can be replicated using a few lines of Python code or even by copying a formula into Excel.
I went ahead and followed Rhys’s instructions, and sure enough in less than 2 minutes had grid-based visibility working in an Excel spreadsheet. Such fun!
Complete instructions on how to do this yourself are included in Rhys’s post. This method uses interpolation between the grid cells to calculate visibility…


