When ever I create a Dynamo graph, what I do at the end is reviewing the graph (or python code) and ask myself whether it is the fastest flow. (Yes, I’m a Korean. Click if you want to learn a Korean word pali-pali)
There would be a lot of situations, But there are some representative ways to speedup Dynamo.
1. Use Numbers rather than Geometries as possible.
 |
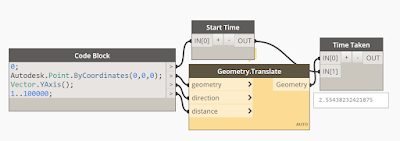
| figure#1. Geometry.Translate |
Figure#1 is a graph to generate 100,000 points by using Geometry.Translate. And it took 2.55 seconds.
 |
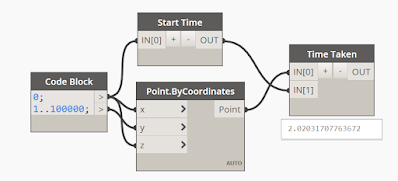
| figure 2. Point.ByCoordinates |
Figure#2 is a graph using Pioint.ByCoordinates from generated coordinates directly to get the same list as figure#1. It took 2.02 seconds.
0.5 seconds doesn’t look long time, it’s literally less than ‘just a second’. But if you are dealing with a large graph and it can contain a huge data set, it won’t be ‘just a second ‘ difference.
2. Don’t make the same data twice or more.
Sometimes, in a large graph, You can create the same lists or items several times just…

