Last week we saw a Dynamo graph that imports a point cloud from an ASCII-based format to specify the initial locations for a fun flocking simulation.
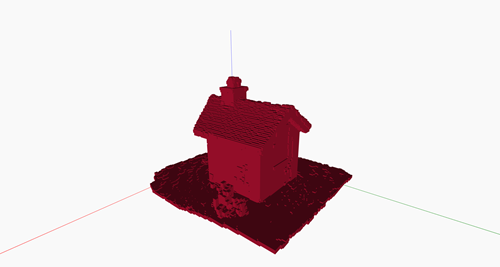
This week we’re going to look at a graph that uses a similar import technique but rather creates a voxel model based on the point cloud:
The main difference from the previous import code is that rather than returning a list of Point objects, we’ve tweaked the code to return 9 doubles for each point that are taken as triangle definitions. The little secret is that the triangle’s vertices are coincident: we use the same XYZ coordinates 3 times.
VASA’s VoxelModel has a handy ByTriangles node that will consume this list to populate itself: wherever a point (defined as a zero area triangle) is ingested that sits within a voxel, that voxel then gets switched on. Obviously many (if not all) voxels will get “hit” by multiple points, so this does in effect simplify the point cloud. And you can choose to read a lot fewer points –…


