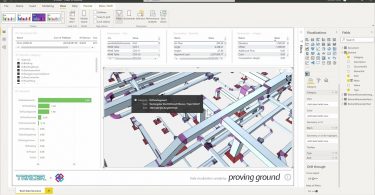
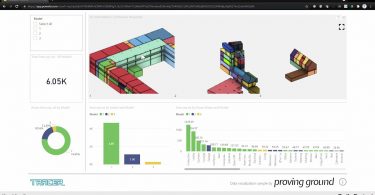
This video shows 3D IFC model data displayed in a Microsoft Power BI report. IFC (‘Industry...
Source : Nathan Miller channel
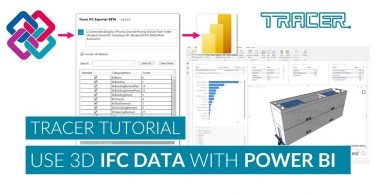
Tracer IFC (Beta) – Connecting IFC data with Power BI with...
This tutorial reviews how to use the new Tracer IFC export tool which converts IFC files to SQLite...
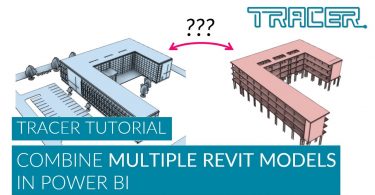
Tracer – Comparing Multiple Revit Models in Power BI with...
This short demo show the opportunity to combine and analyze data from multiple Revit models to...
Tracer Tutorial – Combine Multiple Revit Exports into a...
Tracer allows users to export an Autodesk Revit document into a database file. This tutorial covers...
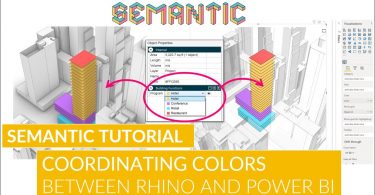
Semantic Tutorial – Coordinating Object Colors between...
Coordinating colors can be quite important for data visualization and analysis. We recently...
Tracer – Interactive 3D Reports with Revit and Power BI
Tracer is a toolkit that enables users to harvest Autodesk Revit data and geometry for use with...
Semantic – Data-Driven Design with Rhino and Power BI in 3D
Semantic is a toolkit for integrating data in Rhinoceros 3D and sharing your models as part of...
Conveyor – Tools for Simple and Direct Rhino + Revit...
Our Conveyor tools provide simple and direct Rhinoceros 3D + Autodesk Revit integrations. Conveyor...
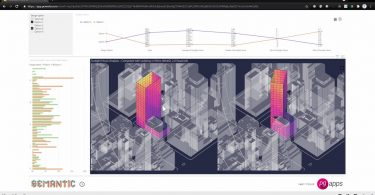
Semantic – Power BI used to Compare 3D Rhino Design with...
This video shows several 3D Rhino architectural design options with data for sunlight hours. The...
Semantic – 3D Model Power BI report with a Ladybug...
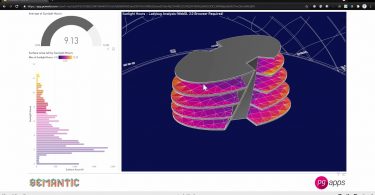
This 3D Power BI report shows a model with a ‘sunlight hours’ analysis study created...


